Thanks to a measurement campaign conducted along the perimeter of the plant, the SCAN360 – QUICK SCAN technology for calculating CH₄ emissions is a method capable of determining the concentrations of the emission plume downwind.
The results obtained by SCAN 360 SMART INSPECTION are combined with meteorological data and site geometry information to estimate gas emissions through inverse dispersion modeling.
The inverse dispersion is carried out using a Lagrangian dispersion model called MICRO-SWIFT-SPRAY, developed by SUEZ AIR&CLIMATE, which can estimate CH₄ emissions for the entire site, as well as provide a list of the main sources along with their respective contributions to total emissions.
The two technologies are complementary: SCAN360 Quick-Scan enables a global assessment of emissions and their contribution using inverse modeling, while SCAN 360 Smart Inspection (based on the use of highly accurate infrared sensors like LGR/Li-COR and advanced numerical dispersion models) identifies and precisely quantifies major emission leaks, offering essential information for mitigation.
This method was initially developed for non-hazardous waste storage facilities under the European project WasteMiti2, funded by the European Union’s main initiative created by the European Institute of Innovation and Technology (EIT) to address climate change through systemic innovation (EIT Climate-KIC). The project developed and validated the method for non-hazardous waste treatment facilities and later for wastewater treatment plants. The method was also evaluated and labeled by the Solar Impulse Foundation under the name “Rapid Scanning Service.”
Indeed, the primary goal of the SCAN360 QUICK-SCAN method is to rapidly “scan” the site’s emissions to quantify them and identify major sources.
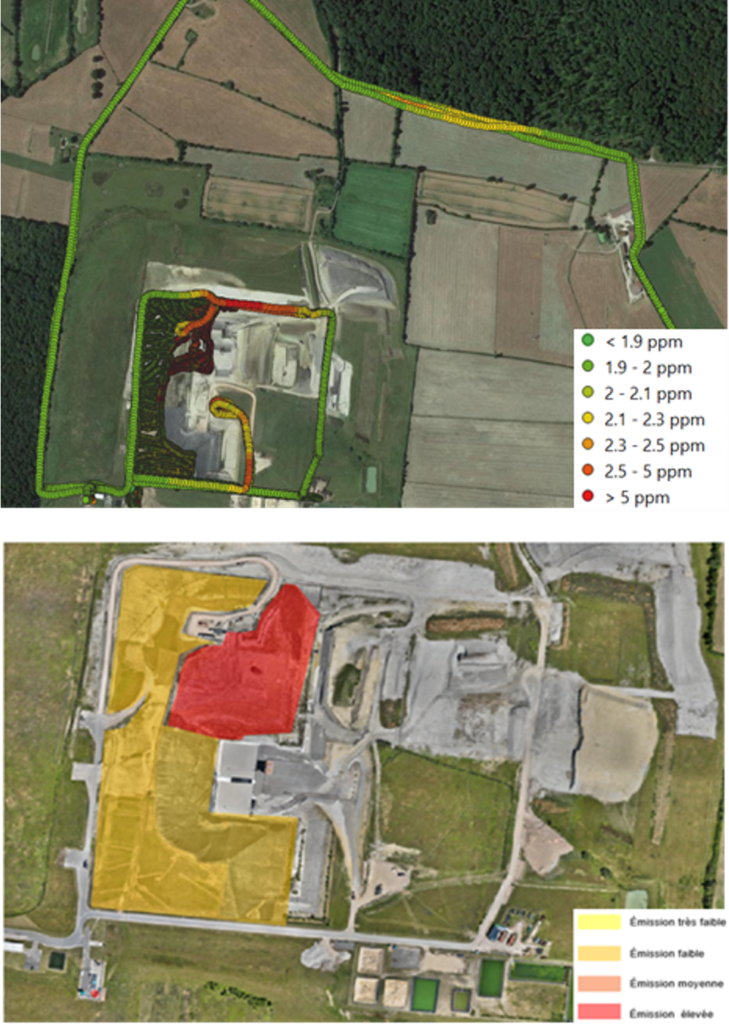
The concentration mapping is initially established by dynamically measuring CH₄ concentrations in ambient air using high-precision, high-frequency spectrometers (LGR/Li-COR sensors). Following the measurements, the emission sources and their respective emission flows can be determined through inverse modeling.
The steps for applying this technology (as applied to specific case studies) are as follows:
After a planning phase
involving site visits and recording CH₄ concentrations, meteorological conditions, etc., on-site monitoring of CH₄ emissions is conducted at the Valdemingómez (Parque Foresta
l) and Las Dehesas landfill surfaces using LGR/Li-COR infrared analyzers.
-
Mapping of CH₄ concentrations on the landfill surface based on in situ measurements with LGR.
-
Quantification of total emissions via inverse modeling to calculate CH₄ emission values and their distribution for each surface source.
Two operational phases are foreseen:
PHASE I: Mapping of CH₄ emissions.
PHASE II: Quantificat
ion of total emissions at the sites of interest.
The first phase involves one day of measurements to determine CH₄ concentrations entering the site. The methane measurement equipment uses a technology called “Off-Axis Integrated Cavity Output Spectroscopy” (Off-Axis ICOS)—an infrared spectroscopy method with an LGR instrument with the following specifications:
-
Measurement frequency: 1Hz
-
Range: 0 – 500 ppm CH₄, 1 – 20,000 ppm CO₂
-
Accuracy (1σ): <2 ppb CH₄ and <300 ppb CO₂
A meteorological station is installed alongside the analyzers to measure local wind speed and direction, temperature, pressure, relative humidity, and solar radiation. Both the analyzers and the weather station are highly portable and allow for continuous measurements, making it possible to analyze large areas in a short time. Measurements will be performed both outside and inside the study area.
From these measurements, a map will be generated to identify areas with varying emission levels and any point leaks. As a result of this phase, a 2D map showing CH₄ concentrations at the studied plant and a 3D downwind map for off-site measurements will be delivered to the client.
In the second phase, the total emissions of the target plant are quantified using inverse modeling, which includes the reconstruction of a digital model of the facility and national topographic data (LIDAR, 2 m resolution).
Meteorological conditions are also modeled.
The output of this phase includes:
-
a 2D concentration map based on the modeling,
-
a table of emissions and their distribution for each surface source,
-
and an estimate of result uncertainty.